flowchart LR
  geom_["geom<span style='color: red;font-size: 18px; font-weight: bold;'>_</span><span style='color: red;font-size: 16px; font-weight: bold;'>geometria</span><span style='color: red;font-size: 18px; font-weight: bold;'>( )</span>"] --> mapping["mapping<span style='color: red;font-size: 18px; font-weight: bold;'>=</span>"]
  mapping --> aes["aes<span style='color: red;font-size: 18px; font-weight: bold;'>(</span>x<span style='color: red;font-size: 18px; font-weight: bold;'>= </span><span style='color: red;font-size: 16px; font-weight: bold;'>variável</span>, y<span style='color: red;font-size: 18px; font-weight: bold;'>= </span><span style='color: red;font-size: 16px; font-weight: bold;'>variável</span>, color<span style='color: red;font-size: 16px; font-weight: bold;'> = variável</span>, fill<span style='color: red;font-size: 16px; font-weight: bold;'> = variável</span>,<br> width<span style='color: red;font-size: 16px; font-weight: bold;'> = variável</span>, size<span style='color: red;font-size: 16px; font-weight: bold;'> = variável</span>, shape<span style='color: red;font-size: 16px; font-weight: bold;'> = variável</span>,<br>linetype<span style='color: red;font-size: 16px; font-weight: bold;'> = variável</span>, alpha<span style='color: red;font-size: 16px; font-weight: bold;'> = variável</span>, stroke<span style='color: red;font-size: 16px; font-weight: bold;'> = variável</span><span style='color: red;font-size: 18px; font-weight: bold;'>)</span>"]
  mapping --> color["aes<span style='color: red;font-size: 18px; font-weight: bold;'>(</span>x<span style='color: red;font-size: 18px; font-weight: bold;'>= </span><span style='color: red;font-size: 16px; font-weight: bold;'>variável</span>, y<span style='color: red;font-size: 18px; font-weight: bold;'>= </span><span style='color: red;font-size: 16px; font-weight: bold;'>variável</span><span style='color: red;font-size: 18px; font-weight: bold;'>)</span>, color<span style='color: red;font-size: 16px; font-weight: bold;'> = '#F0A8D0'</span>,
  fill<span style='color: red;font-size: 16px; font-weight: bold;'> = 'blue'</span>, size<span style='color: red;font-size: 16px; font-weight: bold;'> = 3</span>, shape<span style='color: red;font-size: 16px; font-weight: bold;'> = 17</span>,<br>linetype<span style='color: red;font-size: 16px; font-weight: bold;'> = 'dashed'</span>, alpha<span style='color: red;font-size: 16px; font-weight: bold;'> = 0.5</span>, stroke<span style='color: red;font-size: 16px; font-weight: bold;'> = 2</span>,<br>show<span style='color: red;font-size: 22px; font-weight: bold;'>.</span>legend<span style='color: red;font-size: 16px; font-weight: bold;'> = False</span>|<span style='color: red;font-size: 16px; font-weight: bold;'> True</span>"]
Introdução
Dada a flexibilidade e o poder do {ggplot2}, não é possível cobrir todos os seus aspectos aqui, portanto, foquei no que considero fundamental.
Dividi o conteúdo em três seções:
Estética - Nesta seção, você vai explorar os elementos estéticos do gráfico, como color, size, fill, entre outros. Isso é especialmente útil para quem está começando no {ggplot2}, já que a função aes() pode ser um desafio inicial.
Rótulos - Aqui, você vai aprender sobre os componentes da função labs(), que é responsável por adicionar títulos, legendas e outros elementos textuais que enriquecem os gráficos.
Tema - Na função theme(), uma das mais complexas e importantes dentro do {ggplot2}. Ela permite personalizar cada detalhe da aparência do gráfico, elevando a qualidade visual da sua apresentação.
Escala - A função scale() é muito versátil, nela você pode configurar os elementos dos eixos com scale_x_continuos() e scale_x_date() e as cores dos elementos gráficos com scale_fill() e scale_colour().
Estética
No {ggplot2}, as estéticas, como color, size, fill, entre outras, podem ser definidas tanto dentro quanto fora da função aes().
A escolha do local onde você posiciona essas estéticas influencia diretamente a forma como os atributos visuais são aplicados ao seu gráfico.
Quando você define as estéticascolor, fill, sizedentro da função aes(), está mapeando essas características para variáveis específicas dos seus dados. Isso significa que os atributos visuais do gráfico, como cor ou tamanho, vão variar de acordo com os valores das variáveis que você selecionou.
Dica
Dentro do aes(), você deve colocar a variável que deseja destacar no gráfico.
Por outro lado, ao definir as estéticas color, fill, size fora da função aes(), você está aplicando valores fixos a essas características para todos os elementos do gráfico. Ou seja, todos os pontos, linhas ou áreas terão o mesmo valor estético, independentemente das variáveis.
Dica
Fora do aes(), você deve especificar o código ou o nome da cor que deseja utilizar.
Rótulos
A função labs() no {ggplot2} é usada para definir e adicionar rótulos e títulos em gráficos. Ela adiciona o texto. No entanto, se quiser personalizar a cor, tamanho e fonte do texto, terá que recorrer a função theme()1.
Com ela, você pode definir títulos para o gráfico, eixos, legendas e legendas secundárias, tornando a visualização mais informativa e esteticamente agradável.
flowchart LR

 labs["labs<span style='color: red;font-size: 18px; font-weight: bold;'>( )</span>"] --> x["x<span style='color: red;font-size: 18px; font-weight: bold;'> = </span><span style='color: red;font-size: 16px; font-weight: bold;'>`título do eixo x`</span>"]

 labs --> y["y<span style='color: red;font-size: 18px; font-weight: bold;'> = </span><span style='color: red;font-size: 16px; font-weight: bold;'>`título do eixo y`</span>"]

   labs --> color["color|fill<span style='color: red;font-size: 18px; font-weight: bold;'> = </span><span style='color: red;font-size: 16px; font-weight: bold;'>`título da legenda`</span>"]

 labs --> title["title<span style='color: red;font-size: 18px; font-weight: bold;'> = </span><span style='color: red;font-size: 16px; font-weight: bold;'>`título do gráfico`</span>"]

 labs --> subtitle["subtitle<span style='color: red;font-size: 18px; font-weight: bold;'> = </span><span style='color: red;font-size: 16px; font-weight: bold;'>`subtítulo do gráfico`</span>"]

 labs --> caption["caption<span style='color: red;font-size: 18px; font-weight: bold;'> = </span><span style='color: red;font-size: 16px; font-weight: bold;'>`nota de rodapé no gráfico`</span>"]

 labs --> tag["tag<span style='color: red;font-size: 18px; font-weight: bold;'> = </span><span style='color: red;font-size: 16px; font-weight: bold;'> `tag no canto superior esquerdo do gráfico`</span>"]

 labs --> alpha["alpha<span style='color: red;font-size: 18px; font-weight: bold;'> = </span><span style='color: red;font-size: 16px; font-weight: bold;'>`transparência de uma <br>variável mapeada`</span>"]

 labs --> linetype["linetype<span style='color: red;font-size: 18px; font-weight: bold;'> = </span><span style='color: red;font-size: 16px; font-weight: bold;'>`tipo de linha de uma <br>variável mapeada`</span>"]
Tema
O theme() no {ggplot2} é uma função poderosa que permite personalizar todos os aspectos visuais de um gráfico.
Ele fornece controle sobre a aparência de elementos como legendas, eixos, painéis de fundo, rótulos, entre outros.
Legenda
A Figura 1 mostra um resumo gráfico dos principais componentes da legenda e de um gráfico {ggplot2}. Nós vamos utilizar esses elementos nos esquemas a seguir.
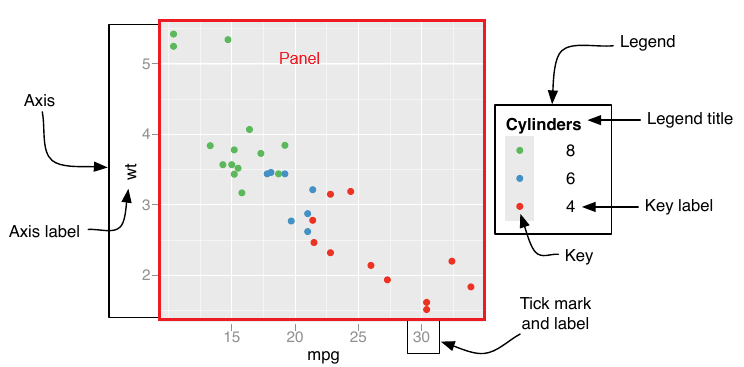
A função legend() permite configurar diferentes características da legenda de um gráfico {ggplot2}. O esquema a seguir desenvolve os elementos essenciais dessa função.
flowchart LR
  A["theme<span style='color: red;font-size: 18px; font-weight: bold;'>( )</span>"] --> B["legend<span style='color: red;font-size: 22px; font-weight: bold;'>.</span>"]
  B --> C["position<span style='color: red;font-size: 18px; font-weight: bold;'>=</span>"]
  C --> 1["'right' | 'left' | 'top' | 'bottom'"]
  C --> 5["<span style='color: red;font-size: 18px; font-weight: bold;'>c(0, 1)</span>"]
  B --> D["direction<span style='color: red;font-size: 18px; font-weight: bold;'>=</span>"]
  D --> 6["'horizontal' | 'vertical'"]
  B --> E["box<span style='color: red;font-size: 18px; font-weight: bold;'>=</span>"]
  E --> 8["'horizontal' | 'vertical'"]
  E --> 10["<span style='color: red;font-size: 22px; font-weight: bold;'>.</span>just<span style='color: red;font-size: 16px; font-weight: bold;'> = </span>'left'|'right'|'center'"]
  E --> 11["<span style='color: red;font-size: 22px; font-weight: bold;'>.</span>background<span style='color: red;font-size: 16px; font-weight: bold;'> = </span>element<span style='color: red;font-size: 16px; font-weight: bold;'>_</span>rect<span style='color: red;font-size: 16px; font-weight: bold;'> (fill = 'white', color = 'black')</span>"]
  B --> F["background<span style='color: red;font-size: 18px; font-weight: bold;'>=</span>"]
  F --> 12["element<span style='color: red;font-size: 18px; font-weight: bold;'>_</span>rect<span style='color: red;font-size: 16x; font-weight: bold;'>(color = 'grey50', fill = 'lemonchiffon', linewidth = 1)</span>"]
  B --> G["key<span style='color: red;font-size: 22px; font-weight: bold;'>.</span>"]
  G --> 13["size<span style='color: red;font-size: 18px; font-weight: bold;'>=</span><span style='color: red;font-size: 16px; font-weight: bold;'>unit(0.9,'cm')</span>"]
  G --> 14["width<span style='color: red;font-size: 18px; font-weight: bold;'>=</span><span style='color: red;font-size: 16px; font-weight: bold;'>unit(0.9,'cm')</span>"]
  G --> 15["height<span style='color: red;font-size: 18px; font-weight: bold;'>=</span><span style='color: red;font-size: 16px; font-weight: bold;'>unit(0.9,'cm')</span>"]
  G --> 16["<span style='color: red;font-size: 18px; font-weight: bold;'>=</span>element<span style='color: red;font-size: 16px; font-weight: bold;'>_</span>rect<span style='color: red;font-size: 1x; font-weight: bold;'>(color = 'grey50')</span>"]
  B --> H["margin<span style='color: red;font-size: 16px; font-weight: bold;'>=</span>"]
  H --> 17["margin<span style='color: red;font-size: 16px; font-weight: bold;'>(t = 10, r = 10, b = 10, l = 10)</span>"]
  B --> I["text<span style='color: red;font-size: 16px; font-weight: bold;'>=</span>"]
  I --> 18["element<span style='color: red;font-size: 18px; font-weight: bold;'>_</span>text<span style='color: red;font-size: 16px; font-weight: bold;'>(size = 12, face = 'bold', color = 'red', family = 'Arial',<br> hjust = 0.5, vjust = 0.5, angle = 45, lineheight = 1.2)</span>"]
  I --> 19["<span style='color: red;font-size: 22px; font-weight: bold;'>.</span>align<span style='color: red;font-size: 16px; font-weight: bold;'>=0|1</span>"]
  B --> J["title<span style='color: red;font-size: 16px; font-weight: bold;'>=</span>"]
  J --> 20["element<span style='color: red;font-size: 18px; font-weight: bold;'>_</span>text<span style='color: red;font-size: 16px; font-weight: bold;'>(size = 12, face = 'bold', color = 'red', family = 'Arial',<br> hjust = 0.5, vjust = 0.5, angle = 0, lineheight = 1.2)</span>"]
  J --> 21["<span style='color: red;font-size: 22px; font-weight: bold;'>.</span>align<span style='color: red;font-size: 16px; font-weight: bold;'>=0|1</span>"]
Escala de cor da legenda
Para personalizar a “escala de cores” da legenda de um gráfico {ggplot2}, você pode usar as funções guide_colorbar()2 e guide_legend() junto com os componentes de preenchimento fill ou cor color.
Essas funções permitem ajustar aspectos como altura da “barra de cores” (barheight), largura (barwidth) e outras características visuais da legenda.
A função guide_colorbar() é usada para escalas contínuas e permite personalizar a “barra de cores” na legenda.
Vale ressaltar que para usar a função unit você precisará carregar o pacote library(grid).
flowchart LR

scale_color["scale<span style='color: red;font-size: 18px; font-weight: bold;'>_</span>color<span style='color: red;font-size: 18px; font-weight: bold;'>_</span>continuous<span style='color: red;font-size: 16px; font-weight: bold;'>( )</span>"] --> name["name<span style='color: red;font-size: 18px; font-weight: bold;'> = </span><span style='color: red;font-size: 16px; font-weight: bold;'>'nome'</span>"]
scale_color --> low["low<span style='color: red;font-size: 18px; font-weight: bold;'> = </span><span style='color: red;font-size: 16px; font-weight: bold;'>'blue'</span>"]
scale_color --> high["high<span style='color: red;font-size: 18px; font-weight: bold;'> = </span><span style='color: red;font-size: 16px; font-weight: bold;'>'red'</span>"]
scale_color --> breaks["breaks<span style='color: red;font-size: 18px; font-weight: bold;'> = </span><span style='color: red;font-size: 16px; font-weight: bold;'>c(12, 14, 16, 18, 20)</span>"]
scale_color --> labels["labels<span style='color: red;font-size: 18px; font-weight: bold;'> = </span><span style='color: red;font-size: 16px; font-weight: bold;'>c('Very Low', 'Low', 'Average')</span>"]
scale_color --> limits["limits<span style='color: red;font-size: 18px; font-weight: bold;'> = </span><span style='color: red;font-size: 16px; font-weight: bold;'>c(10, 22)</span>"]
scale_color --> oob["oob<span style='color: red;font-size: 18px; font-weight: bold;'> = </span><span style='color: red;font-size: 16px; font-weight: bold;'>scales::squish</span>"]
scale_color --> guide["guide<span style='color: red;font-size: 18px; font-weight: bold;'> = </span>"]
guide --> guide_colorbar["guide<span style='color: red;font-size: 18px; font-weight: bold;'>_</span>colorbar<span style='color: red;font-size: 16px; font-weight: bold;'>( )</span>"]
guide_colorbar -->barheight["barheight<span style='color: red;font-size: 16px; font-weight: bold;'> = unit(2, 'cm')</span>"]
guide_colorbar -->barwidth["barwidth<span style='color: red;font-size: 16px; font-weight: bold;'> = unit(1, 'cm')</span>"]
guide_colorbar -->title.position["title<span style='color: red;font-size: 18px; font-weight: bold;'>.</span>position<span style='color: red;font-size: 16px; font-weight: bold;'> = 'top'</span>"]
guide_colorbar -->title.hjust["title<span style='color: red;font-size: 18px; font-weight: bold;'>.</span>hjust<span style='color: red;font-size: 16px; font-weight: bold;'> = 0.5</span>"]
guide_colorbar -->title.vjust["title<span style='color: red;font-size: 18px; font-weight: bold;'>.</span>vjust<span style='color: red;font-size: 16px; font-weight: bold;'> = 0.5</span>"]
guide_colorbar -->direction["direction<span style='color: red;font-size: 16px; font-weight: bold;'> = 'horizontal'</span>"]
guide_colorbar -->ticks.colour["ticks<span style='color: red;font-size: 18px; font-weight: bold;'>.</span>colour<span style='color: red;font-size: 16px; font-weight: bold;'> = 'black'</span>"]
guide_colorbar -->ticks.linewidth["ticks<span style='color: red;font-size: 18px; font-weight: bold;'>.</span>linewidth<span style='color: red;font-size: 16px; font-weight: bold;'> = 0.5</span>"]
A guide_legend() é usado para criar legendas discretas. Portanto, adequada para variáveis categóricas ou fatores, onde cada nível da variável recebe uma cor, forma ou outro atributo visual distinto.
flowchart LR

guides["guides<span style='color: red;font-size: 18px; font-weight: bold;'>( ) </span>"]
guides --> color["color | fill<span style='color: red;font-size: 18px; font-weight: bold;'> = </span>"]
color --> guide_legend["guide<span style='color: red;font-size: 18px; font-weight: bold;'>_</span>legend<span style='color: red;font-size: 16px; font-weight: bold;'>( )</span>"]
guide_legend -->title["title<span style='color: red;font-size: 16px; font-weight: bold;'> = título</span>"]
guide_legend -->title.position["title<span style='color: red;font-size: 22px; font-weight: bold;'>.</span>position<span style='color: red;font-size: 16px; font-weight: bold;'> = 'top'</span>"]
guide_legend -->title.theme["title<span style='color: red;font-size: 22px; font-weight: bold;'>.</span>theme<span style='color: red;font-size: 16px; font-weight: bold;'> = </span>element<span style='color: red;font-size: 16px; font-weight: bold;'>_</span>text<span style='color: red;font-size: 16px; font-weight: bold;'>(size = 12, face = 'bold')"]
guide_legend -->label["label<span style='color: red;font-size: 16px; font-weight: bold;'> = T</span>|<span style='color: red;font-size: 16px; font-weight: bold;'> F"]
guide_legend -->label.position["label<span style='color: red;font-size: 22px; font-weight: bold;'>.</span>position<span style='color: red;font-size: 16px; font-weight: bold;'> = 'top'</span>"]
guide_legend -->label.theme["label<span style='color: red;font-size: 22px; font-weight: bold;'>.</span>theme<span style='color: red;font-size: 16px; font-weight: bold;'> = </span>element<span style='color: red;font-size: 16px; font-weight: bold;'>_</span>text<span style='color: red;font-size: 16px; font-weight: bold;'>(size = 12, face = 'bold')"]
guide_legend -->keywidth["keywidth<span style='color: red;font-size: 16px; font-weight: bold;'> = </span>unit<span style='color: red;font-size: 16px; font-weight: bold;'>(1.5, 'cm')"]
guide_legend -->keyheight["keyheight<span style='color: red;font-size: 16px; font-weight: bold;'> = </span>unit<span style='color: red;font-size: 16px; font-weight: bold;'>(1, 'cm')"]
guide_legend -->direction["direction<span style='color: red;font-size: 16px; font-weight: bold;'> = 'horizontal'</span>"]
guide_legend -->ncol["ncol<span style='color: red;font-size: 16px; font-weight: bold;'> = 2</span>"]
guide_legend -->nrol["nrol<span style='color: red;font-size: 16px; font-weight: bold;'> = 3</span>"]
guide_legend -->byrow["byrow<span style='color: red;font-size: 16px; font-weight: bold;'> = T</span>|<span style='color: red;font-size: 16px; font-weight: bold;'> F"]
guide_legend -->reverse["reverse<span style='color: red;font-size: 16px; font-weight: bold;'> = T</span>|<span style='color: red;font-size: 16px; font-weight: bold;'> F"]
guide_legend -->override.aes["override<span style='color: red;font-size: 22px; font-weight: bold;'>.</span>aes<span style='color: red;font-size: 16px; font-weight: bold;'> = </span>list<span style='color: red;font-size: 16px; font-weight: bold;'>(size = 5, shape = 16, alpha = 1)</span"]
Painel do gráfico
Os elementos do panel() controlam a aparência de área em que o gráfico é plotado.
flowchart LR
  A["theme<span style='color: red;font-size: 18px; font-weight: bold;'>( )</span>"] --> B["panel<span style='color: red;font-size: 22px; font-weight: bold;'>.</span>"]
  %% A --> C["aspect<span style='color: red;font-size: 22px; font-weight: bold;'>.</span>ratio"]
  %% C --> 7["<span style='color: red;font-size: 18px; font-weight: bold;'>=1</span>"]
  B --> 1["background<span style='color: red;font-size: 16px; font-weight: bold;'>=element_rect(fill = 'lightblue', <br>colour = 'blue', size = 1, linetype = 'solid')</span>"]
  B --> 2["border<span style='color: red;font-size: 16px; font-weight: bold;'>=element_rect(fill = 'lightblue', <br>colour = 'blue', size = 1, linetype = 'solid')</span>"]
  B --> 3["grid<span style='color: red;font-size: 18px; font-weight: bold;'>.</span>major<span style='color: red;font-size: 18px; font-weight: bold;'>.</span>x<span style='color: red;font-size: 16px; font-weight: bold;'>= element_line(colour = 'gray', <br>size = 0.5, linetype = 'dotted')</span>"]
  B --> 4["grid<span style='color: red;font-size: 18px; font-weight: bold;'>.</span>major<span style='color: red;font-size: 18px; font-weight: bold;'>.</span>y<span style='color: red;font-size: 16px; font-weight: bold;'>= element_line(colour = 'gray', <br>size = 0.5, linetype = 'dotted')</span>"]
  B --> 5["grid<span style='color: red;font-size: 18px; font-weight: bold;'>.</span>minor<span style='color: red;font-size: 18px; font-weight: bold;'>.</span>x<span style='color: red;font-size: 16px; font-weight: bold;'>= element_line(colour = 'gray', <br>size = 0.5, linetype = 'dotted')</span>"]
  B --> 6["grid<span style='color: red;font-size: 18px; font-weight: bold;'>.</span>minor<span style='color: red;font-size: 18px; font-weight: bold;'>.</span>y<span style='color: red;font-size: 16px; font-weight: bold;'>= element_line(colour = 'gray', <br>size = 0.5, linetype = 'dotted')</span>"]
Elementos gerais do gráfico
O componente theme(plot) afeta o gráfico como um todo.
O plot.background controla o plano de fundo de todo o gráfico3, o plot.title afeta as feições do título e o plot.margin que altera as margens em torno do gráfico.
flowchart LR
  theme["theme<span style='color: red;font-size: 18px; font-weight: bold;'>( )</span>"] --> plot["plot<span style='color: red;font-size: 22px; font-weight: bold;'>.</span>"]
  plot --> background["background<span style='color: red;font-size: 18px; font-weight: bold;'>=</span>"]
  background --> element_rect["element<span style='color: red;font-size: 18px; font-weight: bold;'>_</span>rect<span style='color: red;font-size: 16px; font-weight: bold;'>(fill = 'lightyellow', color = 'black', linewidth = 1)</span>"]
  plot --> title["title<span style='color: red;font-size: 18px; font-weight: bold;'>=</span>"]
  title --> element_text["element<span style='color: red;font-size: 18px; font-weight: bold;'>_</span>text<span style='color: red;font-size: 16px; font-weight: bold;'>(size = 16, face = 'bold', color = 'darkblue', hjust = 0.5)</span>"]
  title --> element_blan["element<span style='color: red;font-size: 18px; font-weight: bold;'>_</span>blank<span style='color: red;font-size: 16px; font-weight: bold;'>( )</span>"]
  title --> position["<span style='color: red;font-size: 22px; font-weight: bold;'>.</span>position<span style='color: red;font-size: 16px; font-weight: bold;'>= 'plot'</span>|<span style='color: red;font-size: 16px; font-weight: bold;'>'panel'</span>"]
  plot --> margin["margin<span style='color: red;font-size: 18px; font-weight: bold;'>=</span>"]
  margin --> margin2["margin<span style='color: red;font-size: 16px; font-weight: bold;'>(t = 10, r = 10, b = 10, l = 10)</span>"]
Eixos
Os eixos são compostos por vários elementos, como títulos, rótulos, linhas e tiques.
A função theme() permite ajustar cada um desses elementos usando element_text(), element_line(), e element_blank().
flowchart LR
  A["theme<span style='color: red;font-size: 18px; font-weight: bold;'>( )</span>"] --> B["axis<span style='color: red;font-size: 22px; font-weight: bold;'>.</span>"]
  B --> C["title<span style='color: red;font-size: 18px; font-weight: bold;'>=</span>"]
  C --> 1["element<span style='color: red;font-size: 22px; font-weight: bold;'>_</span>text<span style='color: red;font-size: 16px; font-weight: bold;'>(size = 14, face = 'italic', color = 'green')</span>"]
  B --> D["text<span style='color: red;font-size: 18px; font-weight: bold;'>=</span>"]
  D --> 2["element<span style='color: red;font-size: 18px; font-weight: bold;'>_</span>text<span style='color: red;font-size: 16px; font-weight: bold;'>(size = 12, color = 'blue')</span>"]
  B --> E["text<span style='color: red;font-size: 22px; font-weight: bold;'>.</span>x<span style='color: red;font-size: 18px; font-weight: bold;'>=</span>"]
  E --> 3["element<span style='color: red;font-size: 18px; font-weight: bold;'>_</span>text<span style='color: red;font-size: 16px; font-weight: bold;'>(size = 12, face = 'bold', color = 'purple',<br> family = 'Arial', <span style='color: purple;'>hjust = 1</span>, vjust = 0.5, <span style='color: purple;'>angle = 45</span>,<br> lineheight = 1.2, margin = margin(t = 5, r = 5, b = 5, l = 5))</span>"]
  B --> F["text<span style='color: red;font-size: 22px; font-weight: bold;'>.</span>y<span style='color: red;font-size: 18px; font-weight: bold;'>=</span>"]
  F --> 4["element<span style='color: red;font-size: 18px; font-weight: bold;'>_</span>text<span style='color: red;font-size: 16px; font-weight: bold;'>(size = 12, face = 'bold', color = 'purple',<br> family = 'Arial', <span style='color: purple;'>hjust = 1</span>, vjust = 0.5, <span style='color: purple;'>angle = 45</span>,<br> lineheight = 1.2, margin = margin(t = 5, r = 5, b = 5, l = 5))</span>"]
  B --> G["ticks<span style='color: red;font-size: 18px; font-weight: bold;'>=</span>"]
  G --> 5["element<span style='color: red;font-size: 18px; font-weight: bold;'>_</span>line<span style='color: red;font-size: 16px; font-weight: bold;'>(color = 'black', size = 0.5)</span>"]
  G --> 6["<span style='color: red;font-size: 18px; font-weight: bold;'>.</span>length<span style='color: red;font-size: 18px; font-weight: bold;'> = </span>unite<span style='color: red;font-size: 16px; font-weight: bold;'> (0.5, 'cm')</span>"]
  B --> H["line<span style='color: red;font-size: 18px; font-weight: bold;'>=</span>"]
  H --> 7["element<span style='color: red;font-size: 18px; font-weight: bold;'>_</span>line<span style='color: red;font-size: 16px; font-weight: bold;'>(color = 'gray', size = 1)</span>"]
  B --> I["ticks<span style='color: red;font-size: 22px; font-weight: bold;'>.</span>length<span style='color: red;font-size: 18px; font-weight: bold;'>=</span>"]
  I --> 8["unit<span style='color: red;font-size: 16px; font-weight: bold;'>(0.2, 'cm')</span>"]
Configuração das facetas
O argumento strip dentro da função theme() refere-se à personalização das faixas de rótulos (etiquetas) que aparecem nas facetas, seja na parte superior ou lateral das facetas.
Essas faixas são usadas para exibir os nomes das categorias que estão sendo facetadas.
flowchart LR
  A["theme<span style='color: red;font-size: 18px; font-weight: bold;'>( )</span>"] --> B["strip<span style='color: red;font-size: 22px; font-weight: bold;'>.</span>"]
  A --> C["panel<span style='color: red;font-size: 22px; font-weight: bold;'>.</span>spacing<span style='color: red;font-size: 18px; font-weight: bold;'>=</span>"]
  A --> aspect.radio["aspect<span style='color: red;font-size: 22px; font-weight: bold;'>.</span>ratio<span style='color: red;font-size: 18px; font-weight: bold;'>=</span>"]
  aspect.radio --> 'number["<span style='color: red;font-size: 16px; font-weight: bold;'>1</span>"]
  B --> D["background<span style='color: red;font-size: 18px; font-weight: bold;'>=</span>"]
  D --> 1["element_rect<span style='color: red;font-size: 16px; font-weight: bold;'>(fill = 'lightgray', color = 'black', linewidth = 1)</span>"]
  B --> E["text<span style='color: red;font-size: 18px; font-weight: bold;'>=</span>"]
  E --> 2["element_text<span style='color: red;font-size: 16px; font-weight: bold;'>(size = 12, face = 'bold', color = 'purple')</span>"]
  B --> F["margin<span style='color: red;font-size: 18px; font-weight: bold;'>=</span>"]
  F --> 3["margin<span style='color: red;font-size: 16px; font-weight: bold;'>(t = 5, r = 5, b = 5, l = 5)</span>"]
  C --> G["unit<span style='color: red;font-size: 16px; font-weight: bold;'>(0.5, 'cm')</span>"]
Escala
Escalas no {ggplot2} controlam elementos dos eixos, legendas e o mapeamento de dados da estética.
No esquema a seguir você encontrará os principais elementos da função.
flowchart LR
  scale["scale<span style='color: red; font-size: 18px; font-weight: bold;'>_</span>"] --> x_continuos["x<span style='color: red; font-size: 18px; font-weight: bold;'>_</span>continuos<span style='color: red; font-size: 18px; font-weight: bold;'>( )</span>"]
  x_continuos --> x_limits["limits<span style='color: red; font-size: 16px; font-weight: bold;'> = c(0,10)</span>"]
  x_continuos --> x_breaks["breaks<span style='color: red; font-size: 16px; font-weight: bold;'> = seq(0, 10, by = 1) </span>"]
  x_continuos --> x_labels["labels<span style='color: red; font-size: 16px; font-weight: bold;'>  = </span>"]
  x_labels --> geral["<span style='color: red; font-size: 16px; font-weight: bold;'>  c('O que quiser', 'Três') </span>"]
  x_labels --> scales["scales<span style='color: red; font-size: 16px; font-weight: bold;'>::dollar_format( ) </span>"]
  x_continuos --> x_expand["expand<span style='color: red; font-size: 16px; font-weight: bold;'> = c(0,0)</span>"]

  scale --> x_date["x<span style='color: red; font-size: 18px; font-weight: bold;'>_</span>date<span style='color: red; font-size: 18px; font-weight: bold;'>( )</span>"]
  x_date --> limits["limits<span style='color: red; font-size: 16px; font-weight: bold;'> = as.Date(c('01/01/2010', '30/01/2010'))</span>"]
  x_date --> limits_lubridate["limits<span style='color: red; font-size: 16px; font-weight: bold;'> = c(lubridate::dmy('16/01/2023'), <br>lubridate::dmy('30/01/2023'))</span>"]
  x_date --> date_labels["date_labels<span style='color: red; font-size: 16px; font-weight: bold;'> = '%d/%m/%Y'</span>"]
  x_date --> date_breaks["date_breaks<span style='color: red; font-size: 16px; font-weight: bold;'> = '1 day'</span>"]

  scale --> fill["fill<span style='color: red; font-size: 18px; font-weight: bold;'>_</span>"]
  fill --> brewer["brewer<span style='color: red; font-size: 16px; font-weight: bold;'>(palette<span style='color: red; font-size: 16px;'> = </span>'set2')</span>"]
  fill --> grey["grey<span style='color: red; font-size: 16px; font-weight: bold;'>(start<span style='color: red; font-size: 16px;'> = </span>0.15, end<span style='color: red; font-size: 16px;'> = </span>1)</span>"]
  fill --> manual["manual<span style='color: red; font-size: 16px; font-weight: bold;'>(values<span style='color: red; font-size: 16px;'> = 'red', 'blue', 'green')</span>"]

  scale --> colour["colour<span style='color: red; font-size: 18px; font-weight: bold;'>_</span>"]
  colour --> manual_color["manual<span style='color: red; font-size: 16px; font-weight: bold;'>(values<span style='color: red; font-size: 16px;'> = 'red', 'blue', 'green')</span>"]
  colour --> brewer_color["brewer<span style='color: red; font-size: 16px; font-weight: bold;'>(palette<span style='color: red; font-size: 16px;'> = </span>'set2')</span>"]
  colour --> grey_color["grey<span style='color: red; font-size: 16px; font-weight: bold;'>(start<span style='color: red; font-size: 16px;'> = </span>0.15, end<span style='color: red; font-size: 16px;'> = </span>1)</span>"]
Em postagens futuras, abordarei alguns componentes que podem ter ficado obscuros apenas com os esquemas gráficos.
Nos vemos na próxima postagem, Aldani👋.
Referências
WICKHAM, H. Ggplot2: Elegant graphics for data analysis. Cham: Springer International Publishing, 2016.
Notas de rodapé
theme_minimal(base_size = 18, base_family = "Source Sans Pro")theme(plot.title.position = "plot" | hjust = 0.5,plot.title = element_text(size = 24,face = "bold",color = "black"),axis.title.x = element_blank() | size = 12, color = "gray50")↩︎A função
guides()também pode ser utilizada de forma independente para controlar a aparência das legendas:guides(size = guide_none())- remove a legenda associada à estética tamanho;guides(color = guide_legend(title = "Espécie", position = "bottom"))- altera o título da legenda de cores para “Espécie” e posiciona-a na parte inferior;guides(color = guide_legend(ncol = 2))- organiza a legenda de cores em duas colunas;guides(color = guide_legend(direction = "horizontal"))- faz a legenda de cores ser exibida horizontalmente;guides(color = guide_legend(title = "Espécie"), size = guide_legend(title = "Largura da Pétala"))- configura o título da legenda de cores como “Espécie” e da legenda de tamanhos como “Largura da Pétala”.↩︎Diferente do
panel.backgroundque controla somente a área dos elementos do gráfico.↩︎